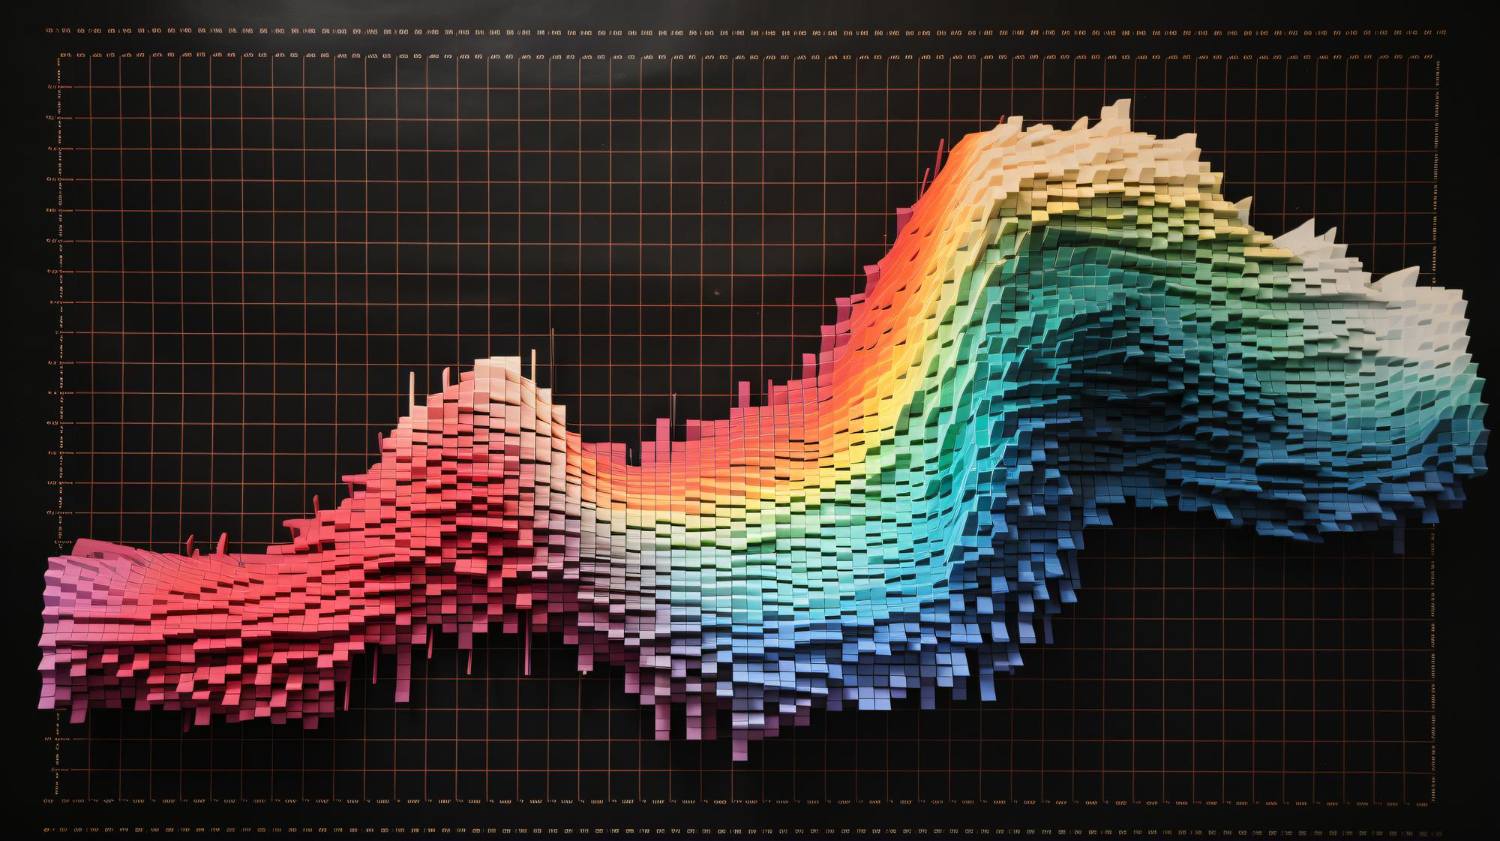
Our course is an opportunity to discover the power of data visualization using one of the most popular tools - GGPLOT2 libraries. Our training is ideal for both beginners and for the basic knowledge in the programming and analysis of these specialists who want to deepen their skills in creating high -quality graphs and diagrams.
The main objectives of the course
- Mastering visualization tools: You will study how to use GGPLOT2 to create graphs, histograms, linear diagrams, scattering diagrams and other types of visualizations.
- Strengthening analytical skills: By visualization of data, you will learn to better understand the trends, relationships and anomalies, which is the key to a successful data analysis.
- Application of practical solutions: The course includes real examples and tasks that will help to transfer the theory to practice and improve the quality of data decisions.
What will you get from our course
The course offers a comprehensive familiarization with visualization methods, including:
- Detailed study of the capabilities of the library GGPLOT2
- The method of choosing a suitable schedule for specific data
- Practical tasks with real data sets for working skills
- Recommendations for improving the presentation of information
Course program
The course consists of several modules, each of which is aimed at an in -depth understanding of aspects of data visualization:
- Introduction to the basics of visualization: At this stage, students will get acquainted with the principles of building graphs, learn about the main elements of visualization and receive an overview of the available libraries in R.
- Work with GGPLOT2: In this module, you will study the syntax and the capabilities of GGPLOT2 in detail. Teachers will explain how to properly structure data and configure graphic objects to achieve the best result.
- Creation of histograms and linear graphs: You will learn how to create histograms to analyze data distribution, as well as build linear graphs to track dynamics and trends.
- Building scattering diagrams: Learn to build scattering diagrams in order to visually evaluate the relationship between variables, identify correlations and anomalies in the data.
- Special visualization techniques: The course also includes a section on the creation of interactive diagrams, setting color schemes and improving graphic aesthetics to increase their information content.
Advantages of training s Loxvuna
- Practical approach: Teachers of the course use real cases and examples, which allows you to immediately apply the knowledge gained in practice.
- Support and feedback: We offer individual support during training. Our experts will help to deal with difficult moments and answer all your questions.
- Flexible schedule: The course program is designed so that students can combine training with work or study. You can go through materials at a convenient pace for you.
- The relevance of knowledge: All topics and examples of the course comply with modern data analysis and visualization.
For whom the course is intended
Our course will be useful to a wide range of specialists:
- For novice programmers and analysts who want to study the basics of data visualization
- For professionals seeking to improve their qualifications and improve ways to present analytical information
- For managers and marketing specialists interested in analysis and interpretation of data
- For students of technical and economic specialties looking for practical knowledge for a future career
How is training
The course is structured in the form of a series of online lectures and practical classes, including:
- Video lessons with detailed explanations
- Interactive tasks with an immediate test of results
- Group discussions and forums to exchange experience
- Real practical cases that allow you to fix skills
You can work at a convenient pace for you, and our support is always nearby to help and consultations on emerging issues. Thanks to this technique, you will quickly master all the necessary tools for effective data visualization in R.
Join the course "Visualization of data in R" from Loxvuna And start creating visually attractive, understandable and informative graphs that will help you achieve new heights in the world of data analysis!

